UI & Interfaces
信息图可视化设计
来源: 小红书号insight_express
分类与属性标签
风格特征
UIInfographic
应用场景
TechEducationTravel
PROMPT WORKSPACE
TXT
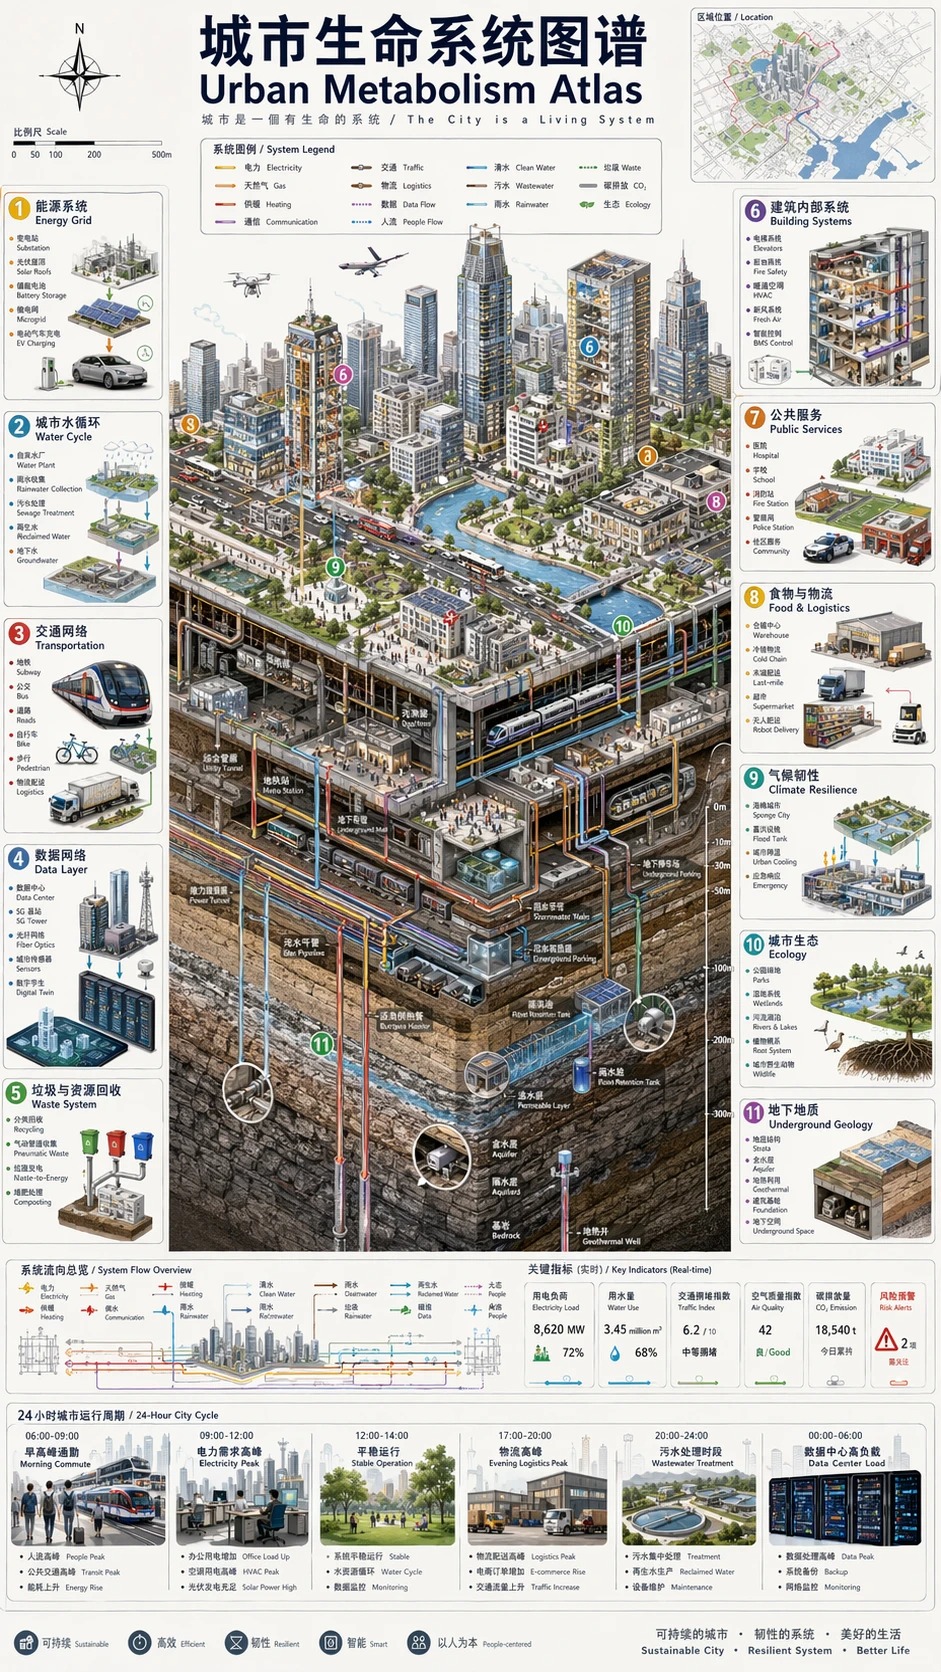
Vertical 9:16 isometric cutaway infographic "城市生命系统图谱 / Urban Metabolism Atlas". Smart city from sky to bedrock: skyscrapers, streets, subway, utility tunnels, water/sewage/gas/heating pipes, fiber, data center, flood tanks, aquifers, geothermal wells, bedrock. Color-coded flows for power/water/data/traffic/waste. 12 numbered panels bilingual CN/EN: 能源/水循环/交通/数据/垃圾/建筑/公共服务/ 物流/气候韧性/生态/地质/治理看板. 24h timeline at bottom. Style: engineering white paper + scientific atlas, light paper bg, crisp lines, 8K. No cyberpunk, no gibberish text, must show both above AND below ground.💡 技巧提示
此提示词已在 Midjourney/SD 实际生成中得到验证。您可以直接复制上面的代码并在绘图工具中运行,也可以替换其中如人物、色彩、构图等关键词来实现定制效果。