UI & Interfaces
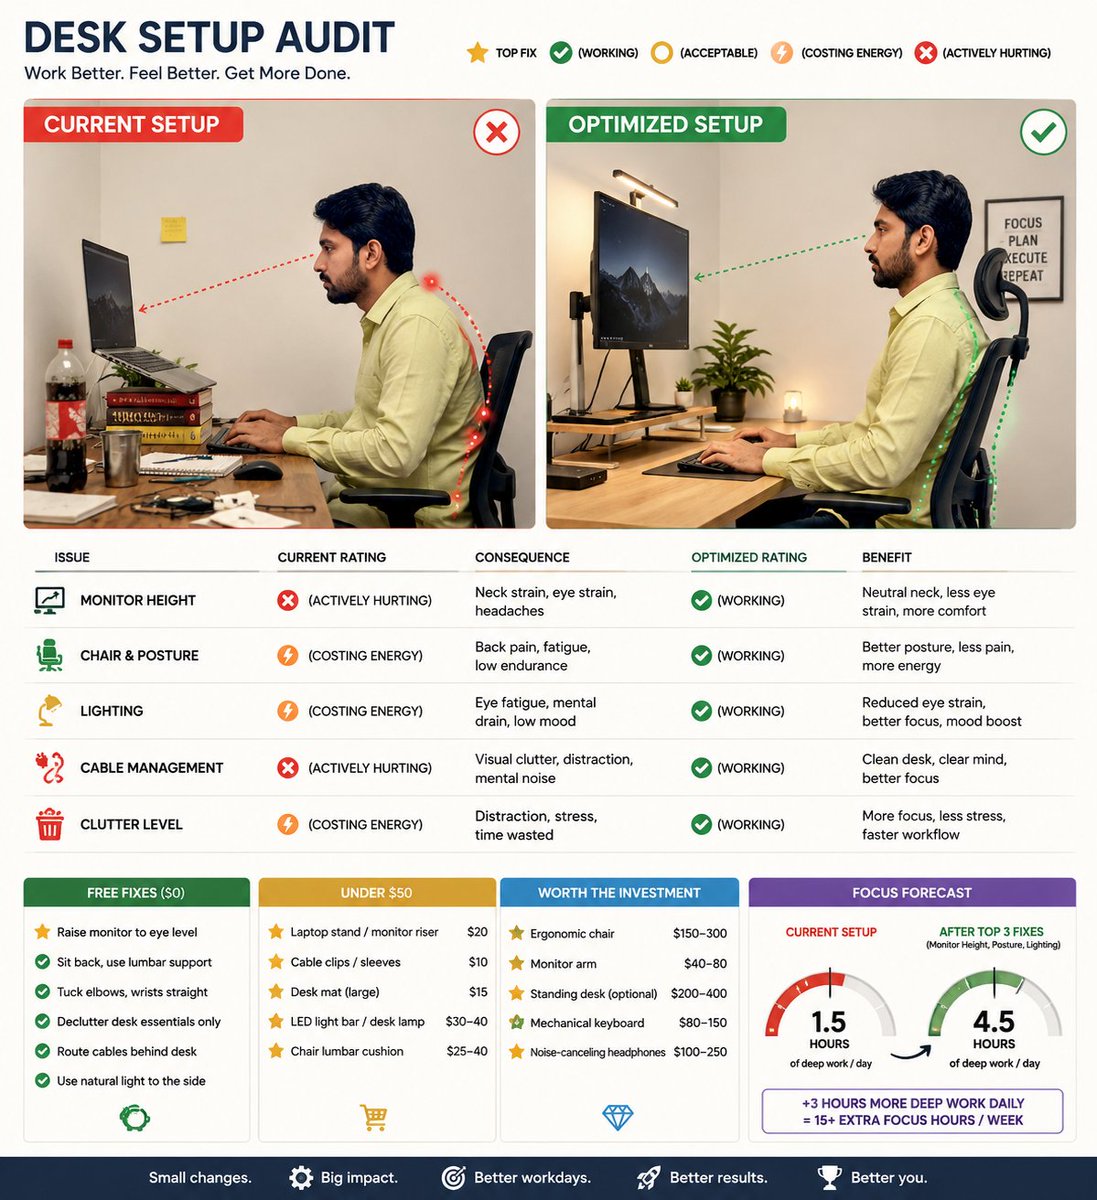
Desk Setup Audit Infographic
来源: @DilshadAI1
分类与属性标签
PROMPT WORKSPACE
TXT
Create a visual-first, editorial-style infographic auditing the desk setup in the attached photo. Show a side-by-side of current vs. optimized setup with annotations on monitor height, chair position, lighting, cable management, and clutter. Rate each issue with symbols like Top Fix, (working), (acceptable), (costing energy), and (actively hurting), tying each to a consequence like back pain, eye strain, or focus loss. Rank fixes by impact and group them into free fixes, under $50, and worth the investment. Include a Focus Forecast gauge predicting daily deep work hours possible with the current setup vs. after the top 3 fixes. Keep it clean, minimal text, no paragraphs.💡 技巧提示
此提示词已在 Midjourney/SD 实际生成中得到验证。您可以直接复制上面的代码并在绘图工具中运行,也可以替换其中如人物、色彩、构图等关键词来实现定制效果。